When freezing temperatures in Texas crippled the state’s power grid and millions of residents lost electricity, communities jumped into action and set up warming centers to provide temporary relief. There has been a lot of discussion in the media on the impact the power outages had on communities of color, so I decided to do some digging. I wanted to know if various populations had equal access to these warming centers. The Texas Division of Emergency Management (TDEM) posted a list of 331 warming centers open to residents across the state. I grabbed the dataset on Feb. 17, which you can download here.
Methodology
I was able to retrieve Census tract and block info for the addresses using a batch upload to Census’ Geocoder tool. The tool did not find data for every address, so I conducted a manual lookup of 146 addresses through a combination of the one-line address lookup or Google Map coordinates. This wasn’t difficult, just time-consuming. I only had one issue locating an address. One center, though listed as being in Texas, was technically located in Texarkana, Arkansas, so I moved the coordinates just across border.
I then merged all the address data with the state’s PUMAs (Public Use Microdata Areas) — taking care to match with the state FIP code so I wasn’t accidentally looking at, for example, California data. The final data with the matched addresses and manual lookups are available here.
Unfortunately only a few centers in the TDEM dataset included capacity, so I had to use the number of centers per PUMA as a variable instead of the number of residents the centers could accommodate. I calculated the number of centers per 100,000 residents, as PUMAs contain no fewer than 100,000 residents. I then pulled data on population, density, median income and race by PUMA. Unfortunately, the race variable in the CPS does not include Hispanic/Latinx as an option. On the maps below I looked at percentage of white and non-white residents. This is far from ideal, but hopefully someone out there with more experience using the CPS could easily correct the issue. I suggest using CEPRdata. I don’t have experience with STATA, only R, and the CPS extracts there were built with STATA.
Findings
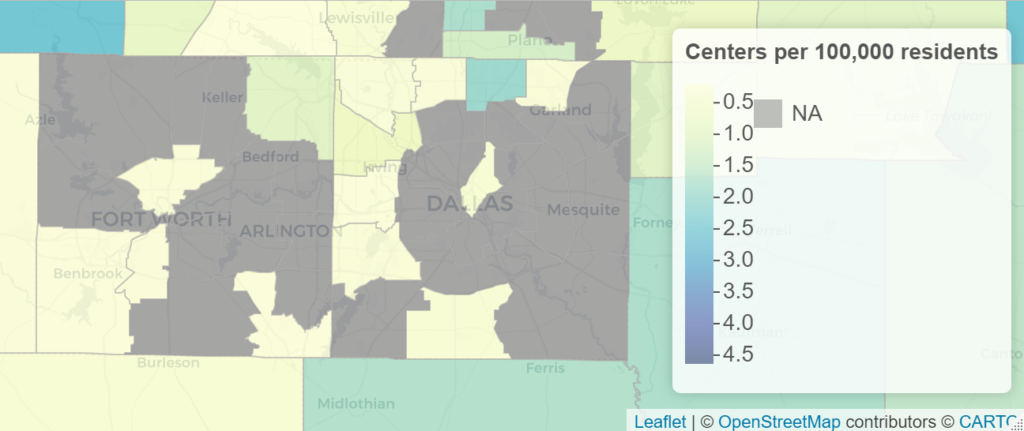
The map below shows the state with centers per 100,000 residents.
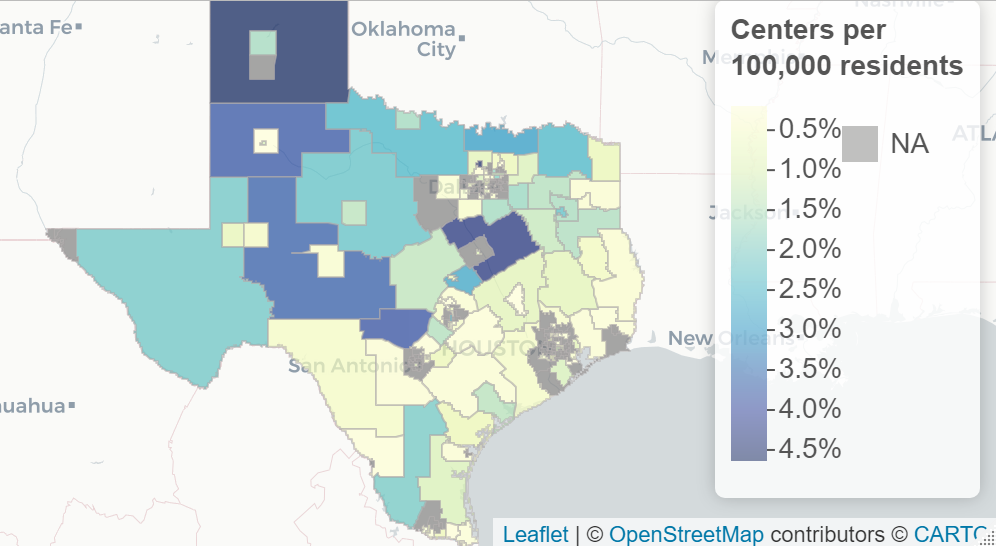
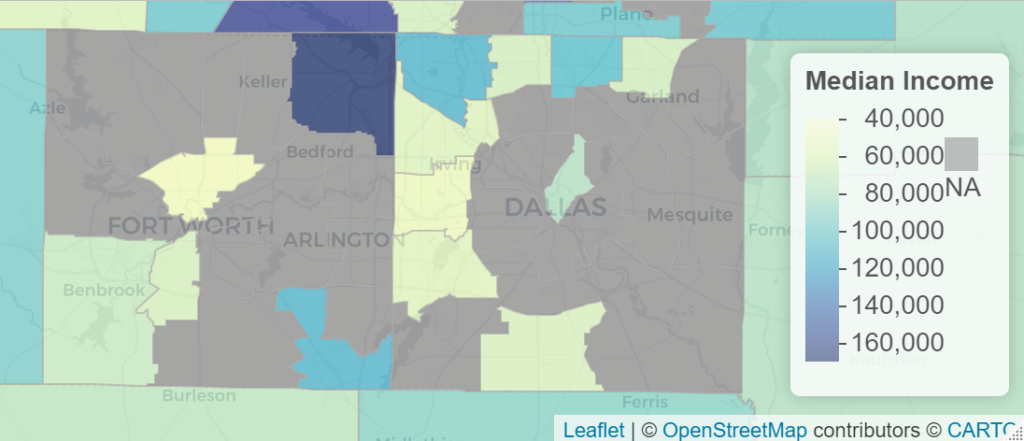
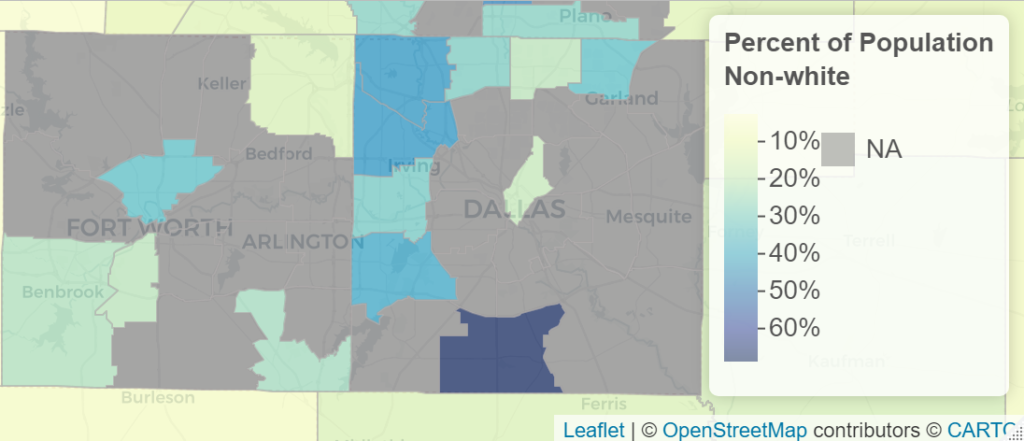
I was drawn to one particular part of the state, the Dallas-Fort Worth area. The Dallas and Fort Worth suburbs appear to have low median incomes, a larger percentage of non-white population, and far fewer centers per 100,000 residents. The grey areas are PUMAs that contain no centers at all, at least not in the TDEM dataset.
Looking at the full dataset, the plot below shows there is a statistically significant (95%) negative correlation between density and centers per 100,000 residents and percentage of non-white population and centers per 100,000 residents. There is also a positive correlation between percentage of non-white population and density. This means areas with higher populations of non-white residents are more dense and likely to have fewer centers per 100,000 residents.
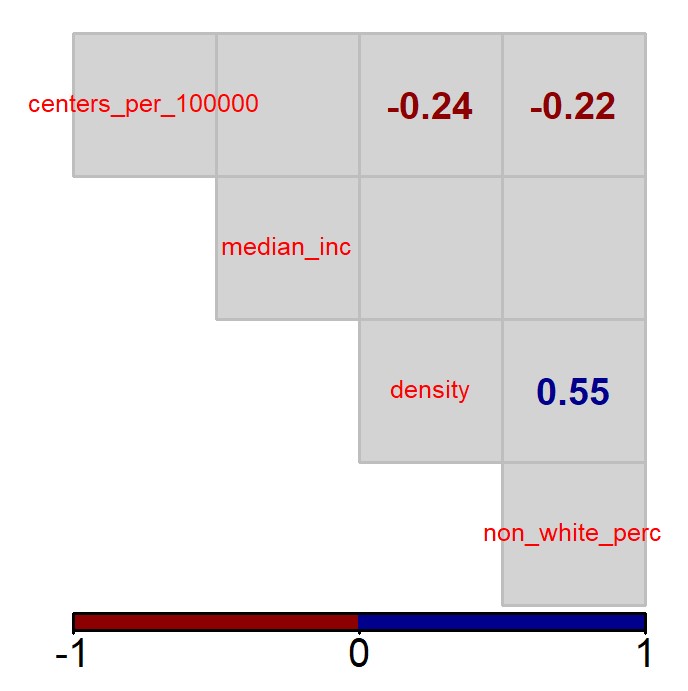
This actually disappears when I subset by the Dallas-Fort Worth-area PUMAs, but that doesn’t mean PUMAs within the area don’t experience disparities.
Discussion
Research from political scientist Daniel Aldrich shows communities with higher social capital are more resilient in the face of disasters. Higher social capital means stronger networks that bond, link and bridge divides between groups and individuals. How is this relevant with warming centers? While TDEM lists warming centers that operate in the state, state and local governments do not operate all warming centers. Some might be city or county facilities, such as rec centers and high school cafeterias, while others might be churches or the headquarters of fraternal organizations such as the Elks or the Knights of Columbus.
The role of state and local governments is still important, though. Using the Texas data as an example, one of Aldrich’s policy recommendations to increase social capital in areas that lack warming centers is the creation of “neighborhood resilience centers.” Mapping out the existing warming centers helps find areas in need. The state and local governments then could distribute funding for the creation of centers that provide resources for residents and create community connections.
Another policy recommendation is to create a network that links these warming centers together to collect and analyze this type of data. That way, at the local level, city and county governments can determine what is needed and act accordingly. One would expect TDEM to be responsible for this task, but since February, the warming center dataset has actually been taken down. More clarification is needed on TDEM’s role in the process.
If someone said a decade ago that at any point in time it would be colder in Texas than in Alaska, we wouldn’t believe it. But climate change has had unexpected effects on weather, and it will continue to do so in the future. State and local governments must be ready for these changes, and that means learning from the past.
Issues
- Race variable is not ideal, especially in a state with a large Hispanic population. It would be nice to drill down by race/ethnicity.
- Capacity data is lacking.
- This data does not take into account “informal” warming centers, such as neighbors opening homes to others. This is a tricky topic, though. In any other year, I would say that this is a major issue. However, we are still in the middle of a pandemic, and I find the effect of “informal” warming centers less compelling. While there are certainly people who will open up their homes to neighbors no matter what, there are also others who may be unwilling because of the risk of contracting COVID-19.
As I said before, hopefully more can be done with this data in combination with other datasets.
References
Aldrich, Daniel P. 2012. Building Resilience: Social Capital in Post-Disaster Recovery. Chicago: The University of Chicago Press.
Steven Ruggles, Sarah Flood, Sophia Foster, Ronald Goeken, Jose Pacas, Megan Schouweiler and Matthew Sobek. IPUMS USA: Version 11.0 [dataset]. Minneapolis, MN: IPUMS, 2021. https://doi.org/10.18128/D010.V11.0


